The planogram is your number one tool for turning shelf space into sales. It is the visual representation of your merchandising strategy: where to place products, how many facings, at what height, and according to what layout rules.
In this guide, discover how to build, deploy, and manage it to maximize performance in large and medium-sized stores.
Set up the frame quickly and correctly
Before opening a software program, align three points: the objective (sales, margin, turnover, launch), the scope (families, store tiers, brands), and brand constraints (furniture formats, labeling, target PDL).
A planogram is not just a pretty picture: it is a contract with the distributor and the basis for your sales pitch.
Choosing the right type of planogram
- Vertical: columns by need or brand; easy comparison, key products at eye level.
- Horizontal: read from left to right when clarity is paramount.
- By blocks: thematic or brand areas to create a mass effect.
- Seasonal: variants based on the commercial calendar.
- Data-driven: built on sales/rotations, scalable through iterations.
- Interactive/digital: multi-store duplication, integrated execution notes.
Tip: Mixing vertical (readability) and blocks (brand power) often gives the best ratio of visibility to sales.
The field method
- Start by mapping out the actual space: linear measurements and heights, obstacles, hot and cold areas. Take photos of the existing situation for your "before/after" shots.
- Continue with a clear segmentation of the product range: families, subfamilies, brands. Give each reference a role (traction, margin, image) and remove duplicates.
- Leverage your data (cash register receipts, seasonality, turnover rates, stockouts). Prioritize what really contributes to revenue and basket size.
- Then design the layout: vertical/horizontal/block choices, facings by reference, key locations (eye level, ends) and useful POS advertising (shelf stoppers, frontons) with legible signage.
- Clean up your product database: EAN codes, exact dimensions, cropped photos to scale. A reliable plan starts with a reliable database.
- Finally, validate the PDL in relation to the agreements. Document your decisions to ensure smooth communication with the brand.
Tools: moving from mockup to network
Planogram software saves you time and ensures consistency: templates by category/format, simulations of facings and innovations, variations by stratum, export of shelf sheets ready for the store.
Connected to the CRM/SFA, it feeds field checklists (prices, stockouts, POS presence, compliance) and centralizes photos.
Result: accelerated deployment, increased plan compliance, fact-driven decisions.
Deployment that sells: pilot, training, execution
Test in a few representative stores for 2 to 4 weeks. Train area managers, merchandisers, and store teams by explaining the logic (not just the photo of the shelf).
Provide a simple implementation kit: detailed plan, list of materials, compliance checklist, restocking schedule. Allow for supervised micro-adjustments to manage local constraints, with supporting photographic evidence.
Measurement and control
Follow a few indicators... but ones that trigger action:
- Sales / margin before–after,
- Turnover rate and breakage rate,
- Digital detention and actual vs. target PDL,
- Planogram compliance (checklist + photos),
- ROI of activations (cross-merchandising, promotions, theatrical displays).
Schedule a monthly or quarterly review. Adjust facings, reinforce winners, remove slow performers. Iteration beats intuition.
Best practices for closing deals faster
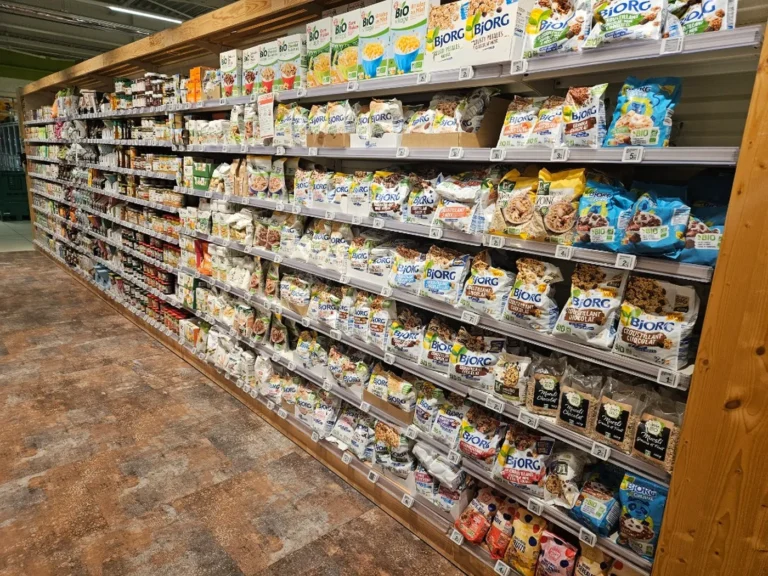
Your mock-up furniture must reflect reality: number of shelves, heights, widths. Readability comes before creativity: shoppers must be able to find what they are looking for in a matter of seconds and discover it immediately afterwards.
Facings serve rotation: too few means disruption; too many means dead stock. Simplify the rules of execution: the shorter they are, the better they are applied.
In case of dramatization, switch to 3D visualization to validate the space requirements and flows. Standardize photos (same angle, same distance, same lighting) to objectively compare your "before/after" shots.
An effective planogram is a repeatable process: clear objectives, reliable data, simple rules, the right tools, and discipline in execution. The result: secure PDL, accelerated rotation, reduced stockouts, and a significantly improved shopping experience.
Let us optimize your shelves!
RMA designs your templates, cleans up your product database, equips your sales force with checklists, and sets up KPIs that make a difference. Let's talk categories, store tiers, and scheduling: contact us by phone at (+33) 4 75 46 77 67 or by email at contact@rmasa.com and let's turn your shelf space into a growth driver.